Why Are the Wealthiest So Wealthy?
Dec 23, 2025·, ,·
0 min read
,·
0 min read
Joachim Hubmer
Elin Halvorsen
Sergio Salgado
Serdar Ozkan
Abstract
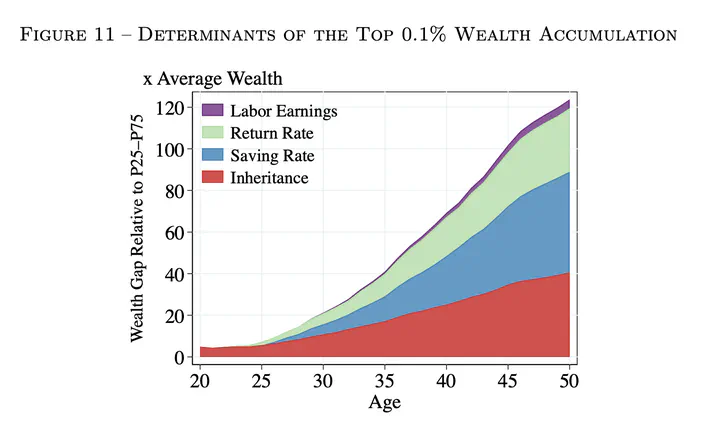
We study the lifecycle dynamics of wealth inequality using 1993-2019 Norwegian administrative panel data on wealth and income. Employing a novel budget-constraint approach, we decompose the excess wealth of the top 0.1% households relative to the median between ages 45 and 64 into higher saving rates (36%), inheritances (31%), returns (28%), and labor income (5%). One-quarter of the wealthiest—the “New Money”—start with negative wealth on average but accumulate rapidly through high labor income and exceptionally high saving rates and returns. The “Old Money” inherit substantial wealth and grow it through above-average though more modest saving and returns. We use these dynamic facts to evaluate five standard wealth inequality models. Although these models match cross-sectional wealth concentration, they fail to reproduce the distinct dynamics of New and Old Money. A heterogeneous entrepreneurship model with decreasing returns to scale technology and nonhomothetic preferences is consistent with the observed dynamics.
Type
Publication
Working Paper.
Econometrica (Conditionally Accepted).
UPDATED DRAFT
Econometrica (Conditionally Accepted).
UPDATED DRAFT